Click below to see impact by area.
Take the conversation to the
next level. See how we’re driving
non-IT influence and solution adoption, while improving the buying experience and
customer loyalty.
Description: Impact driven across the EIFM Marketing portfolio on Enterprise Areas.
Collaboration
❮ Back720
Customer Engagements
Security
❮ Back1,703
Customer Engagements
Enterprise Networking
❮ Back1,462
Customer Engagements
DATA CENTER
❮ Back4,354
Customer Engagements
Click a SEGMENT to see impact by architecture.
In 1HFY15, activities drove engagements that bridged customers’ IT and business agendas in the areas of Cloud, Big Data, Security, and Mobility. For 2HFY15, expect a sharper focus on LOB and Executive IT engagements, as EIFM programs continue to emphasize the connection between our core architectures and formal enterprise solutions such as connected analytics, mobile experiences, branch-in-a-box, intelligent contact centers, and business conferencing and communications.
Description: Impact generated by architecture specific marketing activities on Enterprise accounts.
- Map Markers
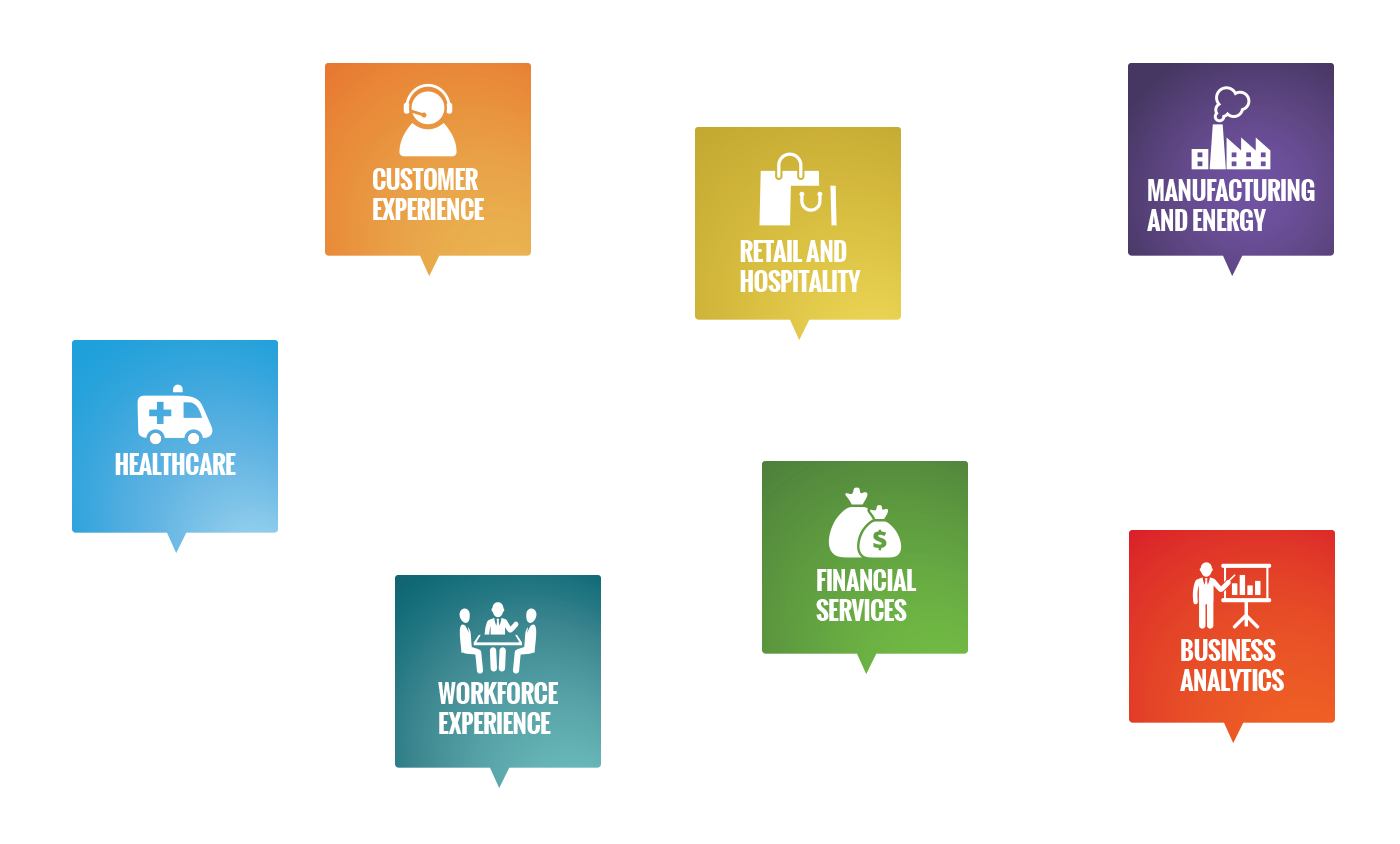
- Healthcare
- Retail
- Manufacturing
- Financial Services
- Customer Experience
- Workforce Experience
- Business Analytics
HEALTHCARE
❮ Back1,472
Customer Engagements
Retail And Hospitality
❮ Back692
Customer Engagements
Manufacturing And Energy
❮ Back3,762
Customer Engagements
Financial Services
❮ Back1,583
Customer Engagements
Customer Experience
❮ Back337
Customer Engagements
Workforce Experience
❮ Back20
Customer Engagements
Business Analytics
❮ Back337
Customer Engagements
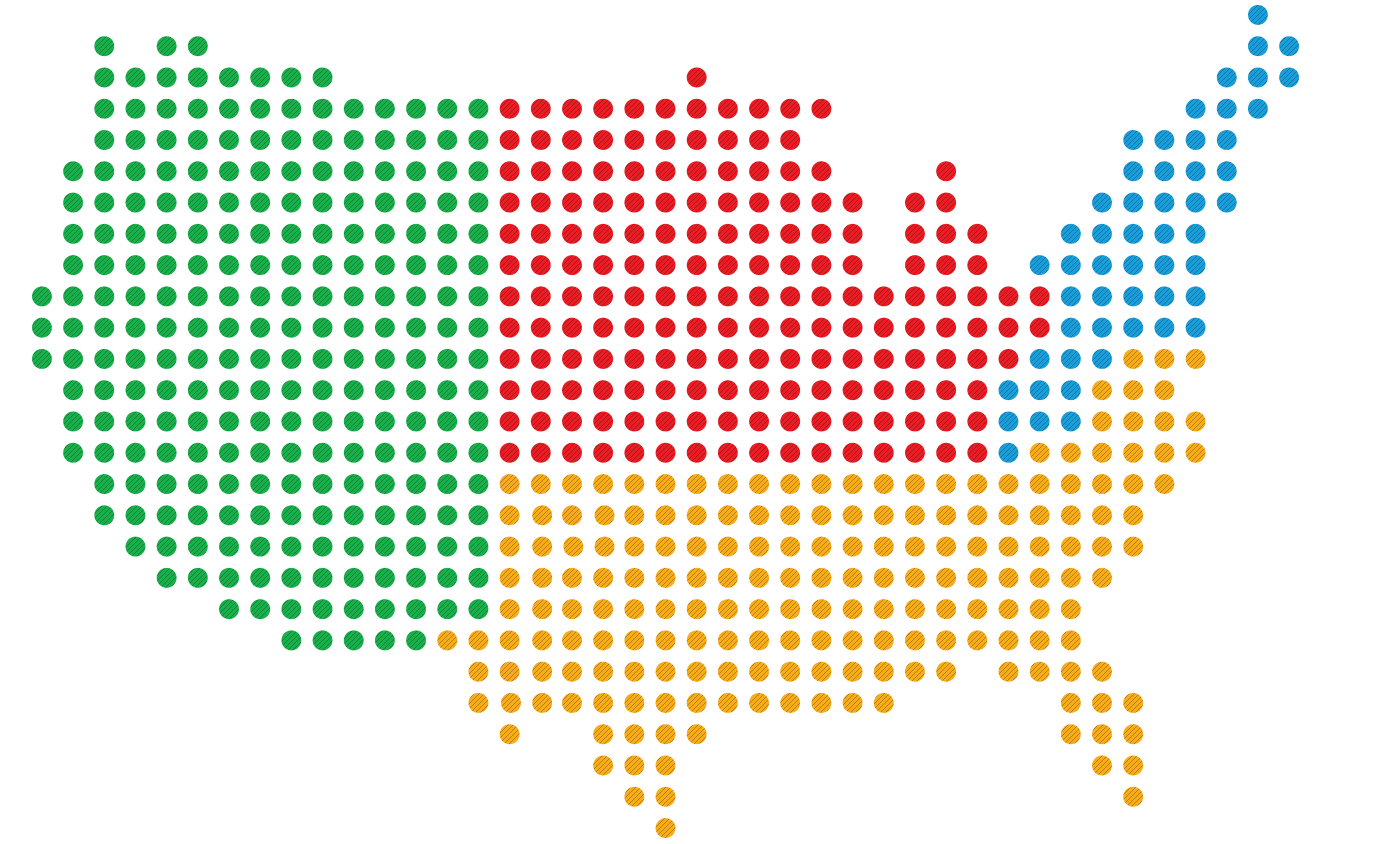
Click the map markers to see impact by vertical or enterprise capability.
Following a balanced portfolio approach to target BTx accounts, with a bias towards high-quality interactions and meaningful engagements. Seeing increased momentum in IoE/IoT.
Description: Impact driven across the EIFM Marketing portfolio on BTx vertical accounts.
*Enterprise capabilties - Impact generated by practice area specific marketing activities on Enterprise accounts.
Social Reach 7,093,645
Social Clicks 37,122
Social Advocacy 1,366
Accounts Engaged 543
Contacts Engaged 11,484
IT Engagements 7,388
LOB Engagements 1,715
Net New Names 3,871
MEU Readership 51.00%
MQL 925
SAL 126
Conversion Rate SAL/MQL 14%
SQL 14
Conversion Rate SQL/SAL 11.00%
SQL S $3,762,000
Marketing Enabled Pipeline $1.362B
Average MEP Deal Size $336K
COI Subscribers 11,179
Social Members 25,307
ASP Engagements 12
ASP MIO S $81,700,000
Social Clicks/Post
+45.75%
16.2 / +5.09IT Engaged
-13.56%
7,388 / -1.16KNet New Names
-27.70%
3.871 / -1.41KSQL#
-30.00%
40 / -6Social Membership
+13.64%
25,307 / +3.04KContacts Engaged
+45.75%
16.2 / +5.09LOB Engaged
-34.79%
1,715 / -915MQL#
+91.51%
925 / +442SQL$
+2,281.01%
$3.76M / +3.6MCOI Subscribers
+3.51%
11.2K / +379